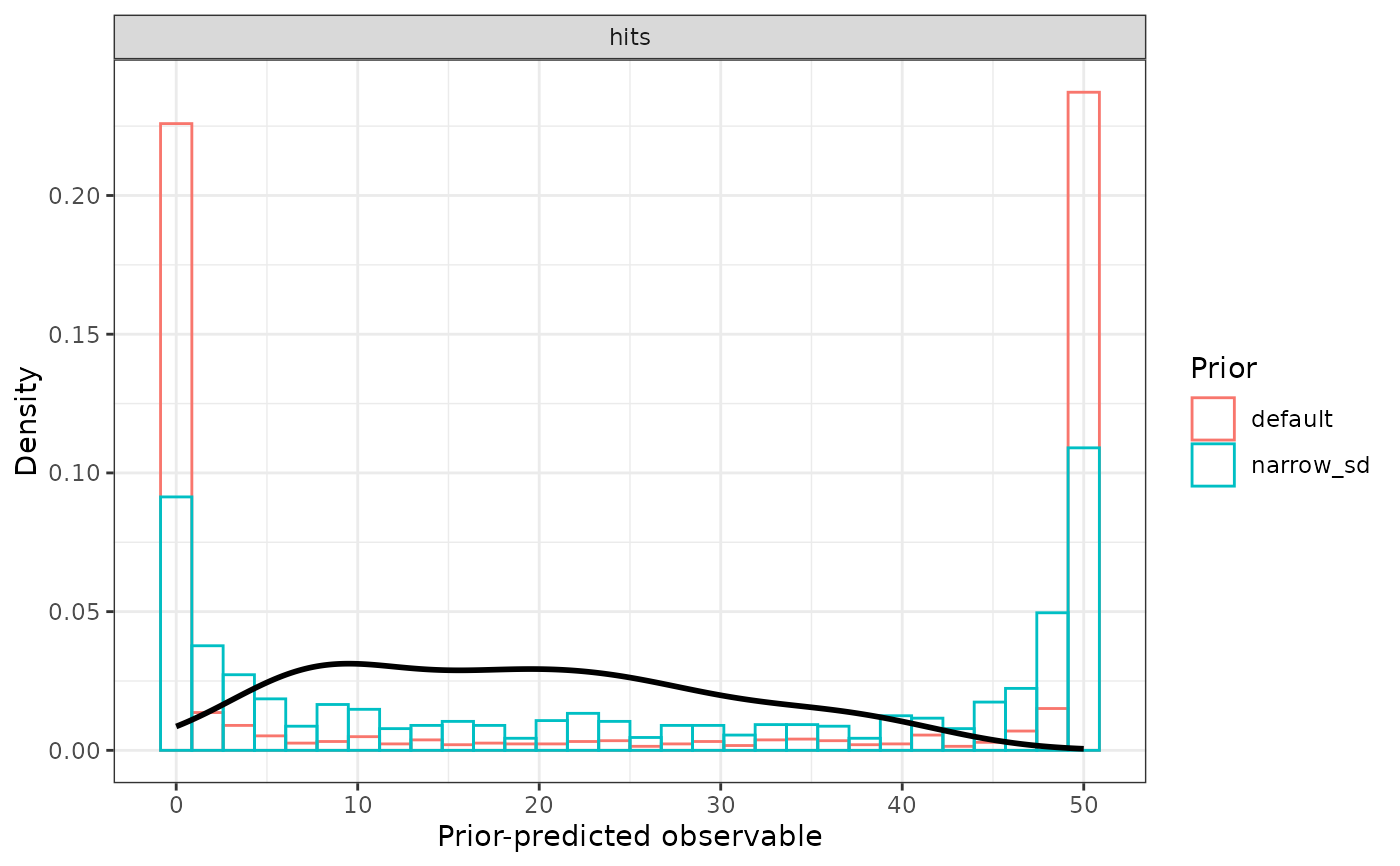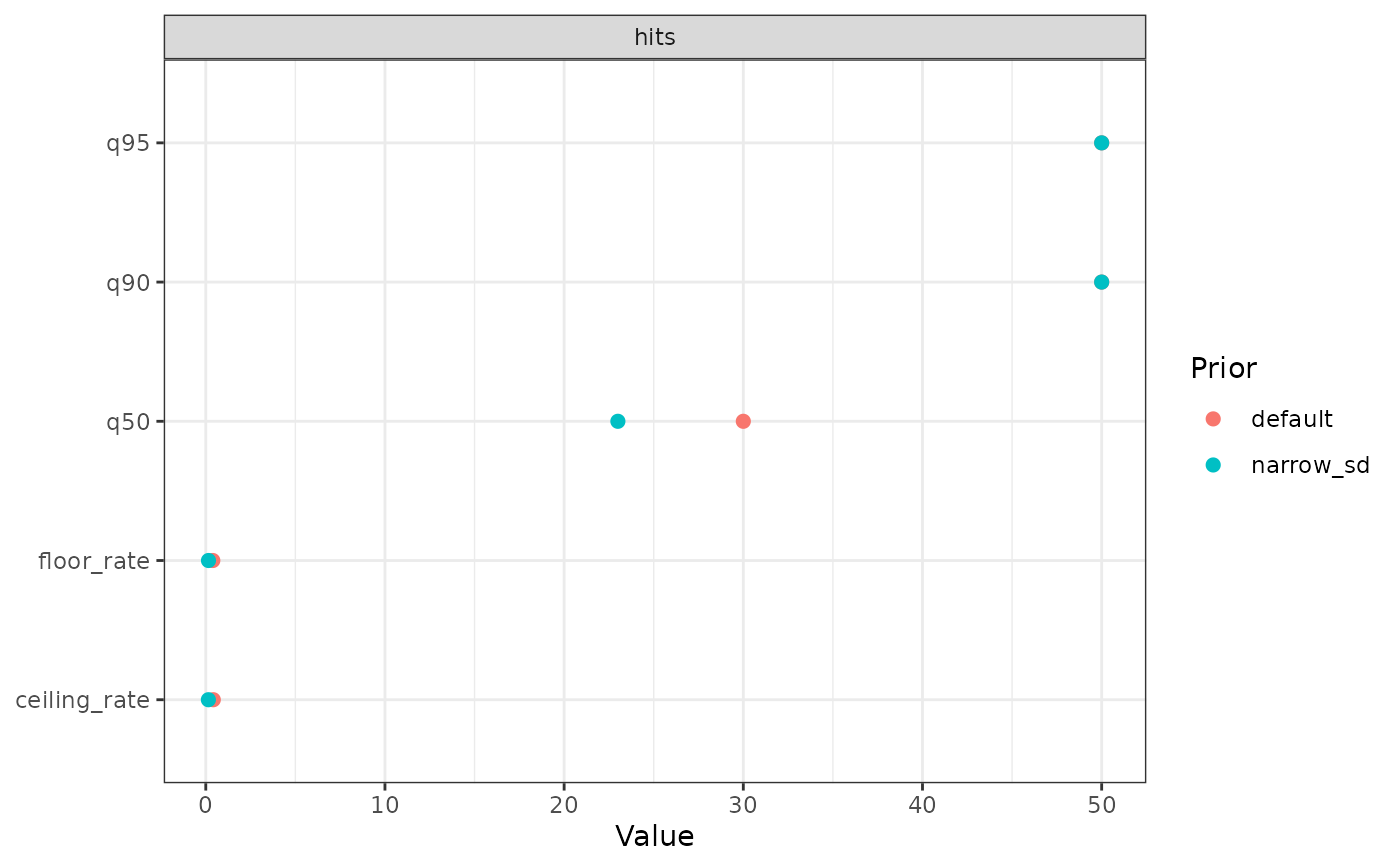
The picture a prior check is read through. "density" draws each
prior-predictive draw as its own thin line, so the spread between
draws stays visible where a single pooled density would hide it;
"histogram" is for a discrete response, where a density is
misleading; "statistic" plots the summary table instead of the
distribution.
Usage
plot_prior_check(
  x,
  type = c("density", "histogram", "statistic"),
  observed = TRUE,
  draws = 50,
  facet_by = "response",
  ...
)
Arguments
- x
A
bmmtools_prior_checkobject fromprior_check().- type
"density","histogram"or"statistic".- observed
Overlay the observed response from the data the check was run over. Dropped without comment when the model's response column is not in that data, since a prior check over a design skeleton has nothing observed to show. Ignored by
"statistic".- draws
Prior-predictive draws to show per set, capped at what the object holds.
- facet_by
A column of
xto make panels from, orNULL."response"by default, so a model with several observables does not share an axis.- ...
Not used.